This page shows the results obtained by applying a number of Global optimization algorithms to the entire benchmark suite of 1-D optimization problems, together with some statistics on the algorithm performances.
Note
The CRS2 and DIRECT algorithms from NLOpt did not qualify for the univariate benchmark as I am constantly getting useless ValueError every time I try them.
Note
The CMA-ES algorithm from CMA-ES did not qualify for the univariate benchmark as the Python implementation does not support optimization in 1-D.
 Univariate (1D) Test Functions
The following table shows the overall success of all Global Optimization algorithms, considering for every benchmark function 100 random starting points.
So, for example, AMPGO was able to solve, on average, 96.2% of all the test functions for all the 100 random starting points using, on average, 182 functions evaluations.
| Optimization Method | Overall Success (%) | Functions Evaluations |
|---|---|---|
| AMPGO | 96.222 | 182 |
| ASA | 58.944 | 318 |
| BasinHopping | 71.222 | 509 |
| DE | 88.889 | 483 |
| Firefly | 99.000 | 490 |
| Galileo | 1.556 | 54 |
| MLSL | 13.833 | 6161 |
| PSWARM | 84.222 | 726 |
| SCE | 99.889 | 105 |
| SIMANN | 5.167 | 1903 |
These results are also depicted in the next figure, which clearly shows that AMPGO is one of the better-performing optimization algorithms as far as the current benchmark is considered.
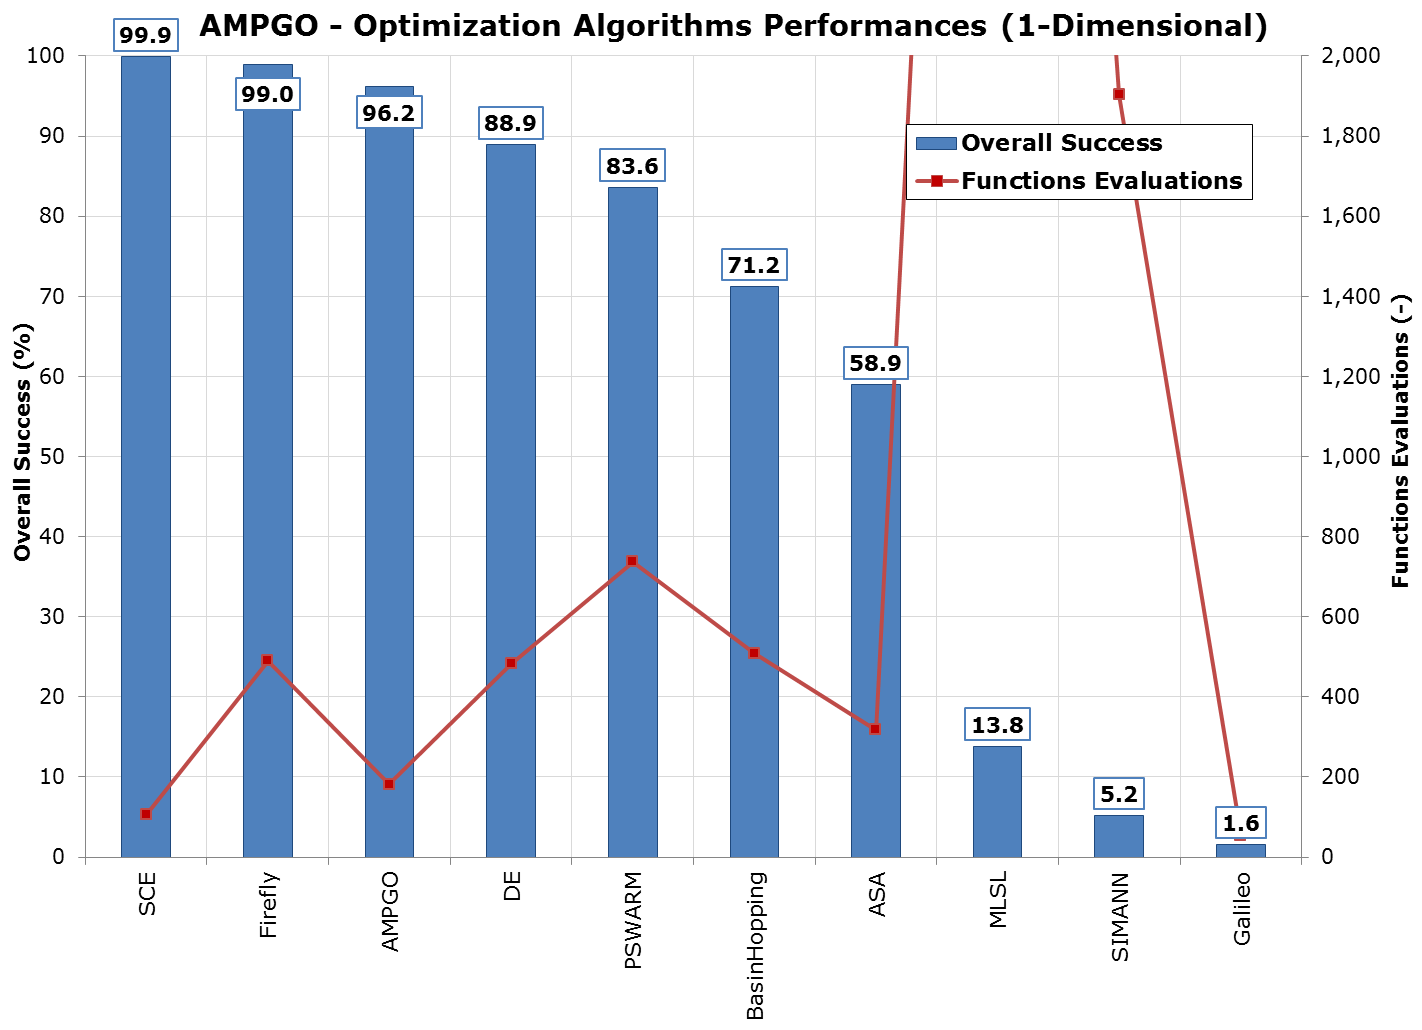
AMPGO Optimization algorithms performances (1-dimensional)
The following table is a split-by-benchmark function of the first table, showing the percentage of successful optimizations per benchmark, considering 100 random starting points.
| Function Name | AMPGO | ASA | BasinHopping | DE | Firefly | Galileo | MLSL | PSWARM | SCE | SIMANN |
|---|---|---|---|---|---|---|---|---|---|---|
| Problem02 | 100 | 100 | 100 | 100 | 99 | 0 | 0 | 100 | 100 | 0 |
| Problem03 | 100 | 0 | 43 | 100 | 99 | 0 | 49 | 36 | 100 | 6 |
| Problem04 | 100 | 100 | 100 | 100 | 100 | 1 | 0 | 100 | 100 | 1 |
| Problem05 | 100 | 99 | 100 | 100 | 96 | 1 | 0 | 100 | 100 | 18 |
| Problem06 | 100 | 100 | 32 | 100 | 100 | 2 | 0 | 100 | 100 | 0 |
| Problem07 | 100 | 100 | 100 | 100 | 98 | 1 | 0 | 100 | 100 | 1 |
| Problem08 | 100 | 0 | 100 | 100 | 100 | 0 | 0 | 26 | 100 | 9 |
| Problem09 | 100 | 75 | 41 | 100 | 98 | 0 | 0 | 100 | 100 | 0 |
| Problem10 | 88 | 0 | 36 | 0 | 100 | 0 | 0 | 100 | 100 | 17 |
| Problem11 | 100 | 100 | 82 | 100 | 100 | 2 | 0 | 65 | 100 | 0 |
| Problem12 | 100 | 0 | 81 | 100 | 100 | 4 | 100 | 46 | 100 | 0 |
| Problem13 | 100 | 100 | 100 | 100 | 100 | 8 | 0 | 100 | 100 | 4 |
| Problem14 | 100 | 100 | 84 | 100 | 99 | 1 | 0 | 100 | 100 | 1 |
| Problem15 | 100 | 100 | 54 | 100 | 100 | 5 | 0 | 100 | 100 | 0 |
| Problem18 | 100 | 87 | 100 | 100 | 100 | 1 | 100 | 100 | 100 | 0 |
| Problem20 | 100 | 0 | 36 | 100 | 100 | 0 | 0 | 100 | 100 | 0 |
| Problem21 | 43 | 0 | 24 | 100 | 100 | 1 | 0 | 100 | 100 | 32 |
| Problem22 | 100 | 0 | 67 | 0 | 93 | 0 | 0 | 43 | 98 | 0 |
The following table is a split-by-benchmark function of the first table, showing the average number of functions evaluations for successful optimizations only, considering 100 random starting points.
| Function Name | AMPGO | ASA | BasinHopping | DE | Firefly | Galileo | MLSL | PSWARM | SCE | SIMANN |
|---|---|---|---|---|---|---|---|---|---|---|
| Problem02 | 38 | 296 | 671 | 235 | 509 | 51 | 7303 | 194 | 77 | 2001 |
| Problem03 | 254 | – | 400 | 469 | 939 | 56 | 3909 | 2360 | 265 | 1283 |
| Problem04 | 6 | 340 | 511 | 246 | 219 | 52 | 7341 | 167 | 44 | 2000 |
| Problem05 | 116 | 323 | 732 | 92 | 477 | 56 | 7026 | 360 | 126 | 1945 |
| Problem06 | 145 | 310 | 256 | 323 | 604 | 54 | 7294 | 309 | 76 | 2001 |
| Problem07 | 47 | 322 | 640 | 279 | 397 | 53 | 7419 | 214 | 65 | 1997 |
| Problem08 | 138 | – | 766 | 283 | 915 | 58 | 5254 | 2579 | 252 | 1251 |
| Problem09 | 66 | 316 | 443 | 224 | 541 | 57 | 7289 | 291 | 124 | 2001 |
| Problem10 | 543 | – | 533 | 2005 | 553 | 55 | 7554 | 211 | 74 | 1944 |
| Problem11 | 17 | 316 | 507 | 905 | 482 | 56 | 6647 | 1296 | 93 | 2001 |
| Problem12 | 120 | – | 584 | 190 | 419 | 46 | 59 | 1737 | 87 | 2001 |
| Problem13 | 7 | 334 | 722 | 169 | 150 | 55 | 7450 | 174 | 36 | 1996 |
| Problem14 | 67 | 302 | 637 | 257 | 185 | 58 | 6977 | 293 | 104 | 2000 |
| Problem15 | 51 | 325 | 411 | 286 | 218 | 57 | 7897 | 201 | 46 | 2001 |
| Problem18 | 5 | 321 | 354 | 1730 | 420 | 57 | 191 | 180 | 59 | 2001 |
| Problem20 | 89 | – | 259 | 428 | 379 | 52 | 7233 | 274 | 67 | 2001 |
| Problem21 | 1545 | – | 272 | 356 | 722 | 51 | 7314 | 197 | 79 | 1843 |
| Problem22 | 25 | – | 472 | 223 | 708 | 55 | 6743 | 2046 | 216 | 2001 |
